Controlled Mechanical Ventilation (CMV) works


Controlled Mechanical Ventilation (CMV) works
-
Research
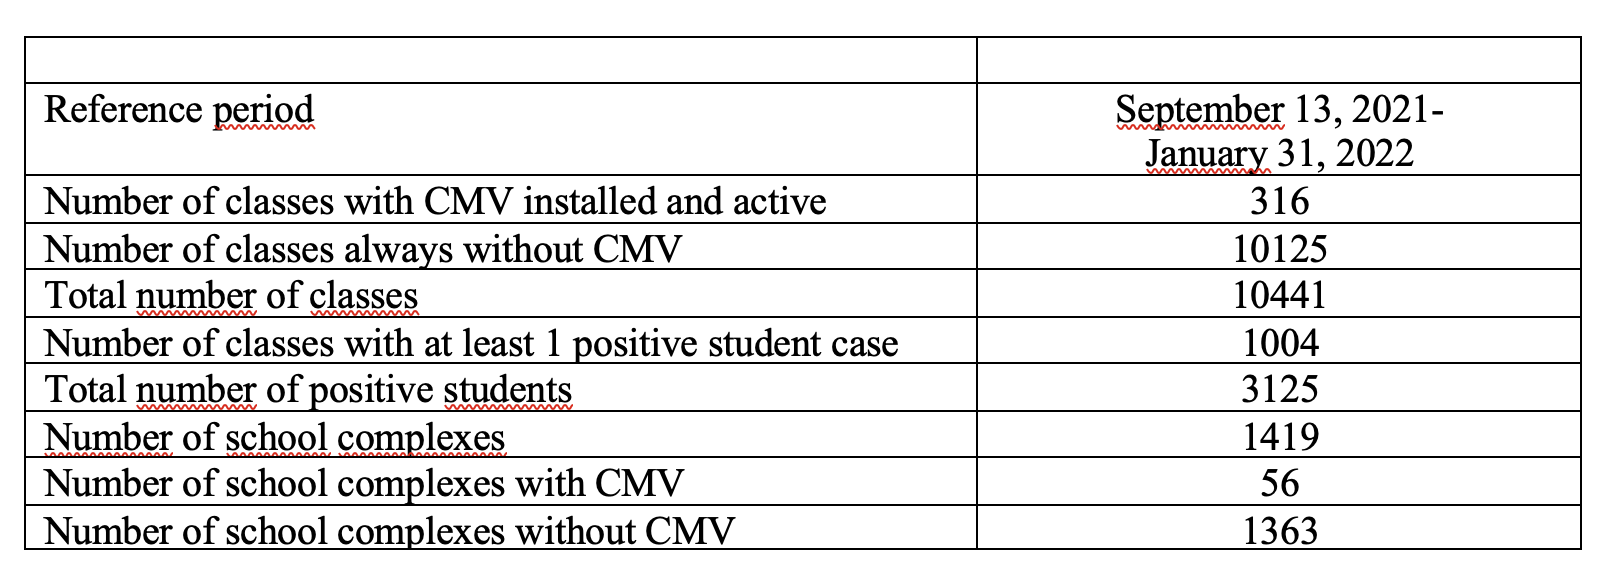
The Marche Region financed, in March 2021, a tender for the purchase and installation of Controlled Mechanical Ventilation (CMV) systems in school classrooms. The aim was to ensure face-to-face lessons, as the available scientific evidence indicated that Controlled Mechanical Ventilation (CMV) was an effective tool to counter the spread of Sars-CoV-2, reducing the permanence of pollutants in the air. The applications were 187, for a total of 3,027 classrooms distributed in 323 schools in the Marche region, for a funded amount of 9 million euros. The first schools benefiting from the funding, set up mechanical ventilation systems during the summer period, in order to start school with active and properly functioning equipment. On this basis, with the collaboration of Hume Foundation, in 2021/2022 a study was developed allowing the comparison between two sets of observations:
1) In the first group: classes with the installation of Controlled Mechanical Ventilation (more than 300, 3% of the classes total)
2) In the second set: classes without mechanical ventilation.
This comparison was structured by analyzing the incidence data (the new positive cases) from Sars-CoV-2 in the two sets under observation (classes with CMV vs classes without ventilation) involving all school levels, from kindergarten to upper secondary school.
On this premise, the Hume Foundation asked the Marche Region to analyze the data collected, in order to estimate the effectiveness of CMV in counteracting the infection’s transmission.
For this purpose, a number of mathematical-statistical models have been built, designed to assess the impact of CMV on the transmission risk, net of other effects such as the order of the school and the number of pupils per class.
-
Methods
To estimate the effectiveness of the CMV, two transmission indicators in particular were used, both based on the cases clusters count (2 or more cases within the same class). The impact of CMV was evaluated both in a rough way, i.e. by comparing the values of the two indicators on homogeneous class groups in terms of air changes per hour, and with regression techniques, keeping under control the number of pupils per class and the type of school.
Among the many estimates of the CMV effectiveness obtained, the most conservative were usually selected.
-
Main result
The risk of transmission can be estimated by calculating, for each class, the ratio between the number of cases related to infections occurring within the class and the number of exposed, ie pupils per class.
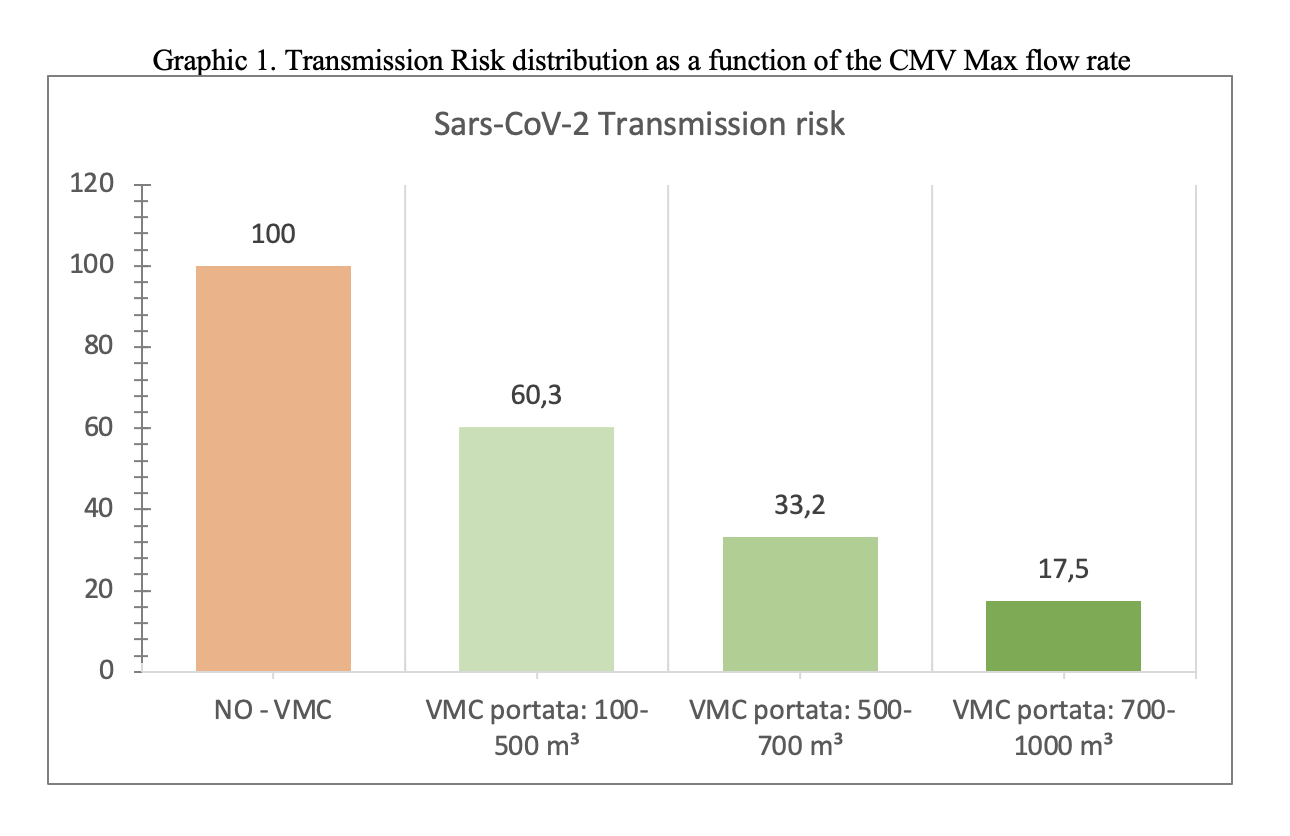
By setting the indicator value for classes without CMV to 100, you can determine the relative risk of infection for classrooms equipped with CMV. This ratio is equal to 37.2%, which means that the presence of CMV reduces the risk of transmission by a factor close to 3 (average indicator).
The maximum capacity of the devices installed varies considerably from school to school, in a range that goes from 100 to 1000 cubic meters-hour. If we distinguish the classes on the capacity of the installed systems, we discover that the relative risk can drop to a value more or less between 5 and 6 if the flow rate exceeds 750 cubic meters per hour, which is equivalent – approximately – to 5 changes per hour. .
All this can be summarized by calculating how the risk reduction factor increases as the quality of CMV increases, measured by the number of air changes.
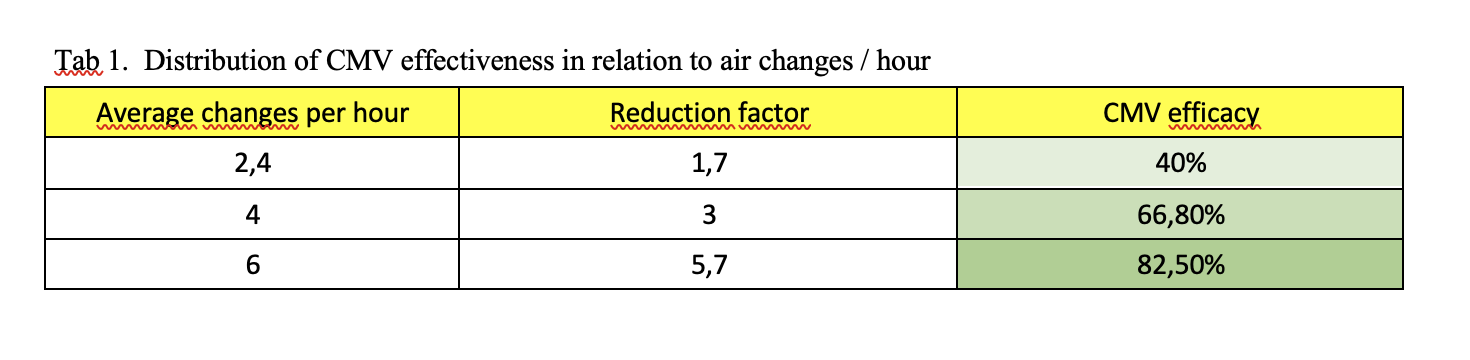
As indicated in table 1, the transmission indicator varies based on the presence of schools with CMV / without CMV or with a different flow rate of cubic meters / hour. A change in efficacy is observed from: 40% correlated to a turnover / hour of 0.67-3.33, to a 66.8% efficacy correlated with 3.33 – 4.67 replacement / hour at 82.5 % efficacy with 4.67-6.66 replacement / hour.
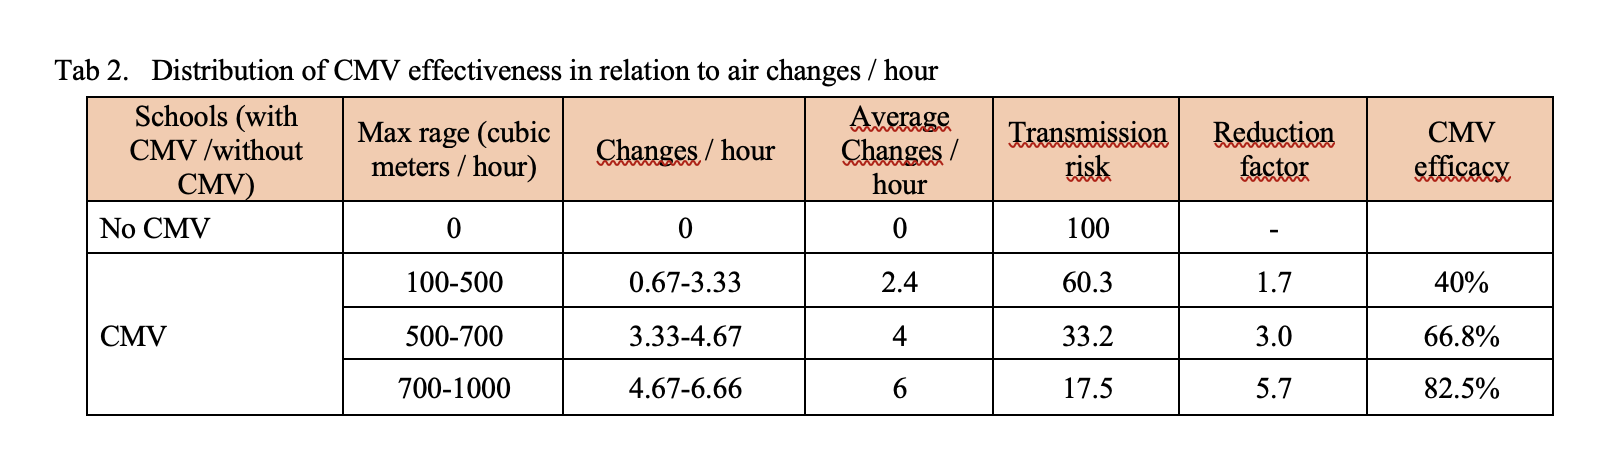
It’s clear that the CMV, especially if adequately sized (6 or more air changes-hour), has the ability to reduce the Sars-CoV-2 infection risk by over 80%. Using it in schools, we could switch from an incidence rate of 250 per 100,000 (risk threshold identified by the Ministry) to a rate of 50 per 100,000.
Surprisingly, the risk reduction factor (between 5 and 6), inferred from this field research, corresponds perfectly to that obtained from the studies of engineers and air quality experts, based on controlled experiments (see Mikszewski, A., Stabile, L., Buonanno, G., Morawska, L., Increased close proximity airborne transmission of the SARS-CoV-2 Delta variant, “Science of the Total Environment”, 816, 2022).
-
Data information
The final data set is a file with 10465 records (equal to the number of classes), each described by 21 variables (plus the class and school identification fields).
The fundamental variables that describe each class are the following:
– province
– plexus
– school order
– section
– year
– number of pupils in the class
– number of positive students in 12 different periods
– presence / absence of the CMV
– CMV plant brand
– CMV system model
The 12 periods correspond to the weeks, except for the initial one, which runs from 13 September to 10 October, and the final one, which runs from 7 to 31 January.
The classes considered are all those without CMV (10125), plus all those with CMV since 13 September (316 out of 340): in all 10441 classes.
Finally, here is some brief information on the classes considered.
For this first phase of the study, the percentage of classes taken into consideration is equal to 3% of the total.